
Modeling V28's 5.8% risk score reduction for a 200,000-life Medicare Advantage plan

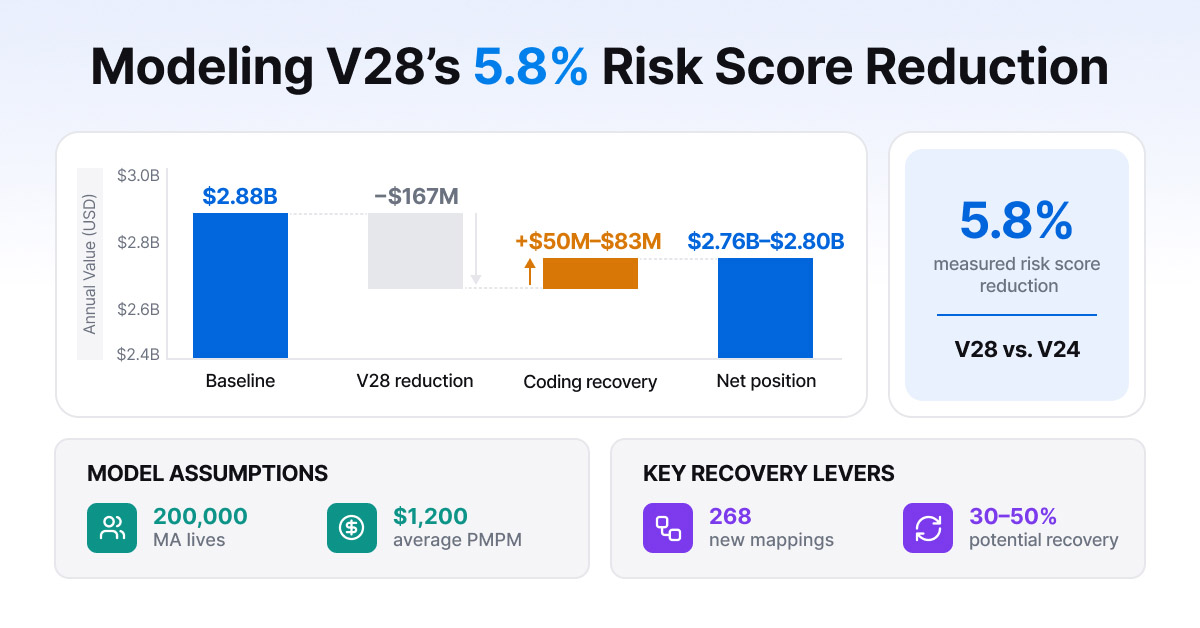
The peer-reviewed academic literature has measured the V28 impact in production. A Health Affairs Scholar analysis published in April 2026 found Medicare Advantage risk scores were 5.8% lower under V28 than under V24 on the same population, with substantial variation across insurers.
For a 200,000-life Medicare Advantage plan that didn't model this carefully going into payment year 2026, the revenue implication is large enough to change the business case for several adjacent decisions. For the CFO modeling the recovery, the temptation is to claim the high-end recovery scenario. I'd resist it. The number worth fighting for is audit-adjusted recovery, not the gross figure.
The 5.8%, translated to dollars
A 200,000-life MA plan with average pre-V28 risk score of 1.0 receives risk-adjusted capitation tied to that score. Illustrative national-average baseline monthly capitation runs $1,100 to $1,400 per member-month before risk adjustment.
200,000 members × 0.058 RAF reduction × 12 months × $1,200 average baseline monthly capitation ≈ $167 million in annual revenue reduction
Your plan's number will differ. Regional rates, benefit design, the plan's pre-V28 baseline, the dual-eligible share, and the share of risk borne by contracted providers all move it. A plan with average pre-V28 risk score of 1.3 sees proportionally larger dollar impact. A plan in a low-capitation region sees a smaller one.
The directional point is robust: $167M is the order of magnitude for a mid-sized plan, not a tail estimate.
Where the 5.8% comes from
The peer-reviewed analysis used 2021 data scored under both V28 and V24 on the same population. The 5.8% gap reflects two structural changes.
Reweighting of chronic conditions. Diabetes, depression, and vascular disease families saw substantial weight reductions in V28. CMS recalibration found these conditions less predictive of cost in newer fee-for-service data than V24 had assumed. Plans with populations skewed toward these conditions see larger-than-average reductions.
Removal of about 2,000 ICD-10 codes from HCC mapping. Diagnoses mapped to HCCs under V24 no longer map under V28. Plans capturing those diagnoses lose the associated RAF.
The Albanese et al. companion analysis in the January 2026 issue (academic.oup.com) documents cross-insurer variation reflecting different starting positions on coding intensity, different population mixes, and different structural exposure to the reweighted condition families.
Where coding precision recovers ground
The 5.8% is baseline assuming coding practices don't change. Programs responding to V28 with disciplined coding can recover meaningful share of the loss.
Recovery comes from three sources.
Catching V28's newly mapped codes. V28 added 268 new diagnosis-to-HCC mappings. A coding program updating its mapping promptly captures these; one that doesn't leaves money on the table.
Reweighted prioritization. Conditions whose weights increased under V28 should be prioritized in both prospective and retrospective workflows. Ranking opportunities by V24 weights misses the new prioritization.
MEAT-tight documentation on surviving conditions. Conditions surviving V28 at reduced weights need documentation tighter, not looser. The V28 environment is also the heightened RADV environment (Commonwealth Fund, January 2026). Revenue recovery is structurally dependent on capture being audit-defensible.
A well-run program can recover 30 to 50% of the baseline 5.8% loss. For the 200,000-life plan: $50 to 83 million in annual revenue recovered out of the $167M baseline reduction.
The three downstream decisions that change
V28's revenue impact doesn't just affect coding strategy. It moves the math on three adjacent decisions.
The in-house argument gets stronger. A plan losing $167M annually to V28 has more reason to bring HCC coding in-house than a plan in the V24 environment did. Cost structure of outsourced coding scales with chart volume; RAF lift available scales with the quality of the work. As the RAF environment tightens, cost-per-RAF-point swings toward in-house.
The prospective allocation gets stronger. Prospective capture is structurally cheaper per RAF point than retrospective. Under V28, where every RAF point costs more to capture, the prospective program deserves more investment.
Provider education matters more. A non-trivial share of V28's impact can be offset by tighter provider documentation. Programs that have neglected provider education for years find the ROI has increased.
The audit-adjusted view
Revenue is one dimension; audit posture is another. A plan recovering 50% of its V28 loss through aggressive retrospective capture and looser MEAT discipline is exposing itself to the RADV expansion CMS announced in 2025 and the False Claims Act framework reinforced by the DOJ March 2026 settlement. Audit-adjusted recovery (defensible RAF capture per dollar of program investment, with audit exposure as contingent liability) is the right framing.
A program recovering $83M through capture practices that won't survive RADV isn't recovering $83M. It's recovering some smaller share net of expected clawback.
What I'd model for 2027
For finance teams updating the forecast for payment year 2027, the three numbers to model explicitly:
- Gross V28 baseline impact: the 5.8% applied to your specific membership and capitation, adjusted for population mix.
- Realistic recovery share: how much of the baseline reduction your current coding posture can recover, modeled at three scenarios (aggressive, moderate, conservative).
- Audit-adjusted recovery: the moderate or conservative recovery share, net of expected clawback at the current RADV exposure level.
The plan that comes out of this exercise with a credible audit-adjusted recovery number is the plan that's modeling V28 correctly. The plan with a single gross-recovery number is missing the second half of the math.
Martlet AI was built around the assumption that capture and audit defense are the same activity. Every code surfaced (in prospective, retrospective, or RADV) carries the same evidence packet. V28 mapping is current and payment-year-aware. For a CFO modeling V28's impact, the integrated engine produces an audit-adjusted recovery rate higher than an aggressive but loose program can claim. The solution pages cover the deployment specifics; our commercial team can run the numbers on your membership.
FAQ
Is the 5.8% a forecast or a measurement?
A measurement. The April 2026 Health Affairs Scholar paper compared 2021 data scored under V28 versus V24 on the same population.
How does this compare with the CMS estimate of V28's impact?
The CMS 2026 Rate Announcement estimated a -3.01% risk-adjustment impact from V28 plus FFS normalization. The 5.8% peer-reviewed measurement reflects the model effect in isolation. The two aren't contradictory.
Does a plan with a healthier population see a smaller V28 impact?
Generally yes. The reductions concentrate in conditions V28 reweighted (diabetes, depression, vascular disease). Lower prevalence of these means proportionally smaller revenue impact.
Realistic V28 recovery range for a well-run program?
30 to 50% of baseline reduction through coding discipline, prospective allocation increases, and provider education. Strong-baseline programs recover less (less room); weaker baselines can recover more.
Should we accelerate retrospective coding to recover faster?
Yes, but only with audit-defensible capture. Aggressive retrospective recovery that doesn't hold up at RADV isn't recovery; it's deferred clawback.